

Occasionally, I forget what I have written in the past, or this case, what I have not written in the past. While my seminars and webinars for the past several years have dealt with approaches to simplify sampling recovery studies, I recently realized I didn’t have a Cleaning Memo on the subject. So here it is. What I am referring to is dealing with sampling recovery studies for the different materials of construction (MOC). This Cleaning Memo will deal with swab sampling recovery studies; next month, we’ll deal with special issues related to different MOCs for rinse sampling recovery studies.
For clarification, a recovery study is a lab study in which the sampling procedure and analytical method are combined to determine a quantitative value for the percent recovery of a specific spiked residue (such as active or detergent) for a specific MOC. That quantitative value is used either to correct values in protocols (either the residue limit or the measured sample value in a protocol) or else to qualify the sampling procedure if a certain minimum percent threshold is met.
If I plan on doing swab sampling in a cleaning validation protocol on different MOCs, then it seems reasonable that I should address (in some way) each MOC as to the applicable recovery percentage. That is, if I plan on performing protocol sampling on stainless steel, PTFE, and EPDM, then I should address each of those MOCs in my recovery studies. There are at least three different ways to address those different materials as I plan my recovery studies.
The most straightforward way is to do a separate recovery study on each material of construction. In the example given above (with swab sampling on stainless steel, PTFE, and EPDM), I would perform a separate swab recovery study on each of the three materials. That is, for each material, I would have at least two operators perform recoveries on three replicate coupons of each MOC. If it were me, I would only perform one spiked level, with that level being at the residue limit in µg/cm2 (see my July 2009 and October 2010 Cleaning Memos on why I think doing recovery studies at multiple spiked levels is a waste of resources). If I do this, I have addressed the issue of recovery on each MOC to be sampled in my cleaning validation protocol.
A second way to address each MOC is to establish a threshold value for the percentage surface area of the total equipment train that a given MOC constitutes. If the material constitutes less than that threshold value, then I don’t do a formal recovery study on that MOC (if it is at that value or above, then a formal recovery study is required). The threshold value typically used is 1% or 2% of the total surface area of the equipment train. In other words, if my threshold is 2%, for any MOC constituting 2% or more of the total surface area, I would perform a laboratory recovery study. For any MOC less than 2% of the total surface area, I would not perform a recovery study.
For those materials where I didn’t perform a laboratory recovery study, I would still apply a recovery percentage in one of two ways. One way is to use the lowest acceptable recovery percentage that is allowed in my cleaning validation master plan. If the minimum acceptable is 50%, for each MOC that was less than the threshold value, I would utilize a recovery percentage of 50%. An alternative is to use the lowest recovery percentage of any similar MOC for which I actually performed a recovery study. By “similar,” what I mean is plastic or metallic. That is, if PTFE is 3% of the total area and EPDM were only 0.5% of the total surface area, I would perform a recovery on PTFE, but not on EPDM. Whatever recovery percentage I obtained on PTFE, I would apply that same percentage to EPDM. In this case, I might also perform a recovery study on stainless steel, but for EPDM, I would utilize the recovery for PTFE, not the recovery value for stainless steel. Another alternative is not to the lowest value of any similar material, but to use the lowest value of any other material on which formal recovery studies were performed (that is, avoid the issue of what is “similar”).
The rationale for this “threshold” approach is that materials that constitute a very low percentage of the total surface area are unlikely to contribute significantly to a total carryover even if the recovery is low. Note that this is true if residues on that surface are transferred to the next product and blended uniformly into that next product. If residues from a surface are transferred to a small number of dose units (or a small portion of the next product), then utilization of this threshold approach is not applicable. An example where it would not be applicable would be stainless steel filling needles for vial filling (of course, it is not likely in that situation that stainless steel from all sources in the equipment train would be less than the threshold percentage). It should also be remembered that it is still a requirement that these MOCs, for which formal recovery studies are not performed, are still expected to be visually clean following cleaning.
Now we get to the third alternative for addressing different MOCs. This can be called a “grouping” approach. This is based on a paper published by scientists at Merck in 2007 (RJ Forsyth et al, “Materials of Construction Based on Recovery Data for Cleaning Validation”, in Pharmaceutical Technology 31:10, pp. 102-116, October 2007). In that article, data were collected on swab recovery studies from 16 Merck manufacturing sites, involving 1262 recovery factor values for 48 different substances (including actives and detergents). This involved 29 different MOCs. The analytical methods varied, and there were slight differences in swabbing procedures from site to site. The data was examined statistically (read the paper itself to see what statistical methods were used). Based on the analysis, the materials of construction were classified into groups with similar recovery factors. The grouping is summarized below, with the highest percent recoveries being in Group A and the lowest in Group E (note that the designation of the groups as A, B, C, D, and E is mine, and is not in the original article)
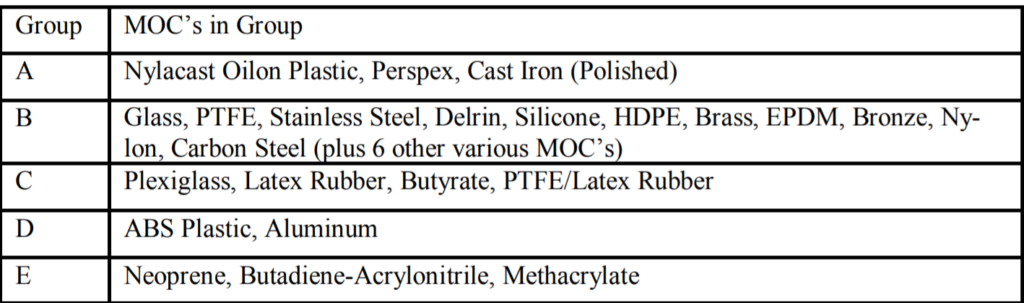
In the original table this is based on, percent recoveries were associated with each group. However, the point of the percent recoveries was not to say that on any material in a given group, a certain percent recovery value was expected. Rather, the point of the grouping was to say that for a given residue, essentially the same swab recovery would be obtained for any MOC in that group. For example, for stainless steel, glass, and PTFE (or for any MOC in Group B), the percent recovery would be the same for a given residue. The authors proposed this analysis to simplify recovery studies on a scientific basis by using a given MOC in a group to represent the recovery value for any material in that group.
This paper by Merck scientists was followed several years later by a publication by scientists at Lilly (BW Pack and JD Hofer, “A Risk-Management Approach to Cleaning-Assay Validation”, in Pharmaceutical Technology 34:6, pp. 48-55, June 2010). While the Merck study involved harvesting data from a wide variety of sites, this Lilly study was a designed study involving swab recovery studies using two different actives (one with a low solubility and one with a high solubility), at several different spiked levels, and to see if there were any trends among MOCs. A total of 14 different MOCs were evaluated. The MOCs evaluated were chosen based on actual MOCs in a clinical trial material manufacturing site. Based on this analysis, the authors divided the MOCs into three (3) groups, based on their percent recovery values. Those groups are presented below, with Group 1 materials having the highest recoveries and Group 3 the lowest.
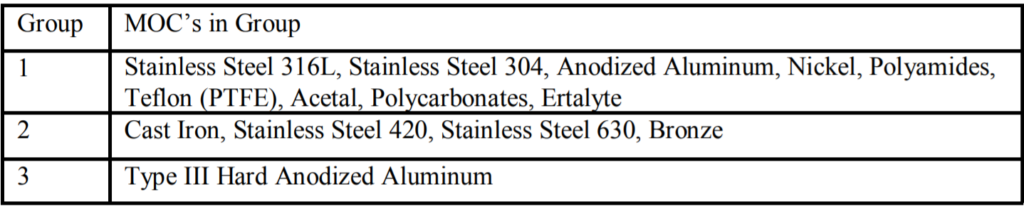
Note that there are similarities and differences in the groupings between the Merck study and the Lilly study, which may be significant, or just may reflect differences in how groups were established (and the different MOCs actually evaluated – 14 in the Lilly paper and 29 in the Merck paper).
What can be done as a result of these publications on grouping? Well, one option is to just apply the groupings that were found, perhaps preferring the Merck approach because of the larger number of MOCs and the larger database it was based on. A second approach is to try to evaluate data that has been collected in an individual facility or company, and confirm whether the grouping approach used by Merck is consistent with actual data from a specific facility or company. The second approach should be preferred, because it combines published results with actual results from that facility/company.
A final clarification. Which option I am utilizing for addressing different materials of construction for swab sampling should be specified in my cleaning validation master plan (or other name for the high-level document that controls what I do for cleaning validation protocols). It just makes good sense to be clear in that document on the approach I am taking.


