

I have for years taught (or preached) that performing quantitative swab recovery studies at multiple spiked levels is a waste of effort and resources. Furthermore, I have also maintained that, other things being equal, the percentage recovery of spiked material will decrease as the spiked level increases. If this is true, then one spiked level at the acceptance limit should be the same or a smaller percentage recovery as compared to lower spiked levels, which is where you are typically expecting your residue values to be in a protocol.
For Cleaning Memos, this was first presented in a Cleaning Memo of July 2007. There were several follow-up ones (July 2009 and September 2013), including one in October 2010 that looked at the actual data that was reported for different spiked levels in several published studies. Two recent papers also have data that seem to support what I teach (although one explicitly questions my approach). Hence, the title of the Cleaning Memo: “Two More Nails in the Coffin,” although realistically I expect the idea of multiple spiked levels for recovery studies will still be around for many years after I am in my coffin.
One study is published online (https://www.pharmaceuticalonline.com/doc/recovery- studies-common-issues-using-statistical-tools-to-understand-the-data-0001) and is titled “Recovery Studies: Common Issues & Using Statistical Tools to Understand the Data”. This is the study that questions my approach (I think my approach is called a “misconception”). While the data generated in this publication does not appear to be developed to disprove contention, it actually supports my contention. Here is the data presented for Case I (which can be viewed online, but the table and associated Figure 1 do not appear when you print the document):
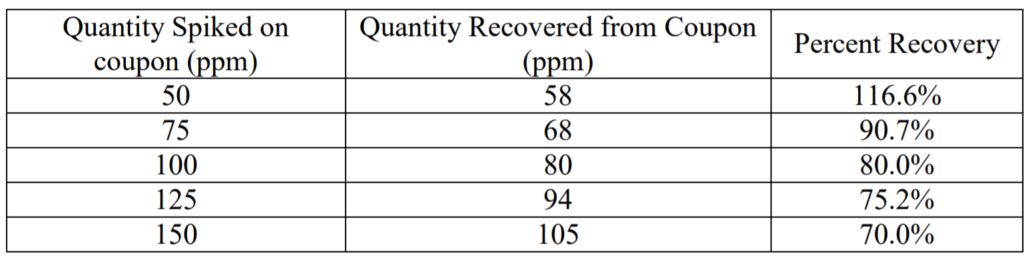
Now, this data would seemingly support my contention that percent recovery decreases with increasing spiked level. However, the equation associated with this data to give a linear response was given by the authors as Y = 33.53 + 0.4752X (with Y being the “Percent Recovery” and X being the “Quantity Spiked”). What this equation means is that if the spiked amount was “zero”, the percent recovery was about 33% (which should not be the case); the high value for what could be the “blank” suggests that there is something amiss. However, in any case, the authors plotted Quantity Recovered (Y axis) versus Quantity Spiked (X axis) and achieved a straight line (make sure you don’t confuse “X/Y axis” with the “values of X and Y” in the equation). An appropriate interpretation of this data is that the slope of the straight line in Figure 1 is the recovery percentage; therefore, over that narrow spiked range of 50-150 ppm, the recovery percentages are essentially the same (about 43%). In other words, the data in Case I in this online publication is amazingly consistent with what I have taught.
The second study was published in PharmTech magazine (July 2020) (https://cdn.sanity.io/files/0vv8moc6/pharmtech/1AKVrrKGSDtbLrcW77HPEwrJM2Ej2yFNYw 43d479.pdf ) and is titled “Qualification of a Swab-Sampling Procedure for Cleaning Validation”. This presents data looking at the different variables in swab recovery studies, including direction of swabbing strokes, swabbed area, swab type, solvent concentration for wetting swabs, surface finish, spiked amount, and personnel doing the swabbing. Note that the spiking material was a detergent, so my expectation would be that recoveries should be relatively high. I had some problems understanding what the authors actually did (the amounts spiked were reported in Table II as 90 or 110 micrograms for either 20.25 or 30.25 cm2, while the text said the spiked levels were 50, 100, and 200 mcg/cm2). However, the key item for this Cleaning Memo is that the authors report that for Sampler I, “the average recoveries could also be seen decreasing with increasing spiked amounts”. Now, don’t think that I am representing this data as supportive of my contentions about the relationship of spiked level and percent recovery. While there were differences between the two samplers, the overall mean pooled recovery percentages were in the 85% to 115% values expected for a spiked material that should have a high recovery. As I look at the results of this study, what it shows is that the personnel doing the sampling are the most important source of variability. Yes, we should try to control the variables as much as possible; but if we are concerned about the variability of swab sampling, we should design our cleaning process to produce residue levels significantly below our acceptance limits.
.
Let me make it clear that I have no well-designed studies that show within narrow ranges the percentage recovery is essentially the same, but that over wide ranges the percentage recovery decreases with increasing spiked levels. I should clarify that last approach by stating that the two main variables (other than the person doing the swabbing) that contribute to the variability of results in recovery studies are the variability of the swabbing itself (mainly the person doing the swabbing) and the variability of the analytical method. There may be other issues that contribute to variability, such as the variability of the amount spiked onto a coupon. It should be clear that generally, the lower the spiked level, the more potential variability there is due to the analytical method itself. What this means is that at very low spiked levels, I may find that the measured percentage recovery is lower than at higher levels. This may particularly be a problem when recovery studies are done near the LOQ of the analytical method. Furthermore, if the spiked amount is at the LOQ, it becomes almost impossible to determine a reliable quantitative percentage recovery unless the recovery is actually 100%.
With all these caveats, I am still open to being disproved. I am more than willing to work with anyone to design a protocol that might disprove my contentions. If you are interested, you should have my contact information.


