

The terms “grouping” and “matrixing” are currently used to refer to the same concept of using a “worst-case” product in a cleaning validation protocol to represent a selection of other products where no or limited protocol runs may be performed for those other products. Successful validation of the cleaning process for that worst-case product constitutes or covers validation of cleaning of those other products. There are generally certain “rules” to follow if this approach is used. However, the point of this Cleaning Memo is not to go into those rules (see the Cleaning Memos of July 2001 and May 2017 for a discussion of those rules). Rather, the purpose is to describe how, in the early days of cleaning validation, and even now to a great extent, the term “matrixing” was used to describe something significantly different in terms of this approach for products.
In the early days of cleaning validation (the 1990s), limits were set based on a “matrix” approach. Remember that limits are always set based on the characteristics of the cleaned product (namely toxicity, originally represented by 0.001 of the daily dose of the active, but now HBEL’s are also used), characteristics of the subsequently manufactured product (namely daily dose of the drug product and batch size), characteristics shared by both products (namely shared equipment surface area), and sampling parameters (for swab sampling this is the swabbed area and the solvent extraction amount). The following discussion is based on limit values expressed as the concentration in the swab extraction solution (what I typically call a L4b value; see the Cleaning Memo of September 2012 for this shorthand method of expressing limits). Of course, if you want to only express limits as the MAC or MACO (Maximum Allowable Carryover, or what I call L2), then the shared surface area and sampling parameters would not be used.
So what was done in the early days of cleaning validation (and of course is still done now) was called “matrixing”. According to the Cambridge English Dictionary, a matrix is “a group of numbers or other symbols arranged in a rectangle that can be used together as a single unit to solve particular mathematical problems”. Another definition (from dictionary.com) is “a rectangular display of features characterizing a set of linguistic items, especially phonemes, usually presented as a set of columns of plus or minus signs specifying the presence or absence of each feature for each item.” The key seems to be the idea of a rectangular presentation or analysis.
What was done then was to calculate the limit of each product based on the possibility of every other product being the next product made in the same equipment. This involved the consideration of two matrices. In the examples given, I will consider a simple case of ten products being made on one of three possible equipment trains. The products will be called A through J, and equipment trains will be called P, Q, and R. A first matrix is presented in Table 1, with equipment trains horizontally across the top as columns and products vertically down the side as rows. A plus symbol (+) indicates that the product is made in that equipment train, and a negative symbol (–) indicates the product is not made in that equipment. So this is the resulting matrix:
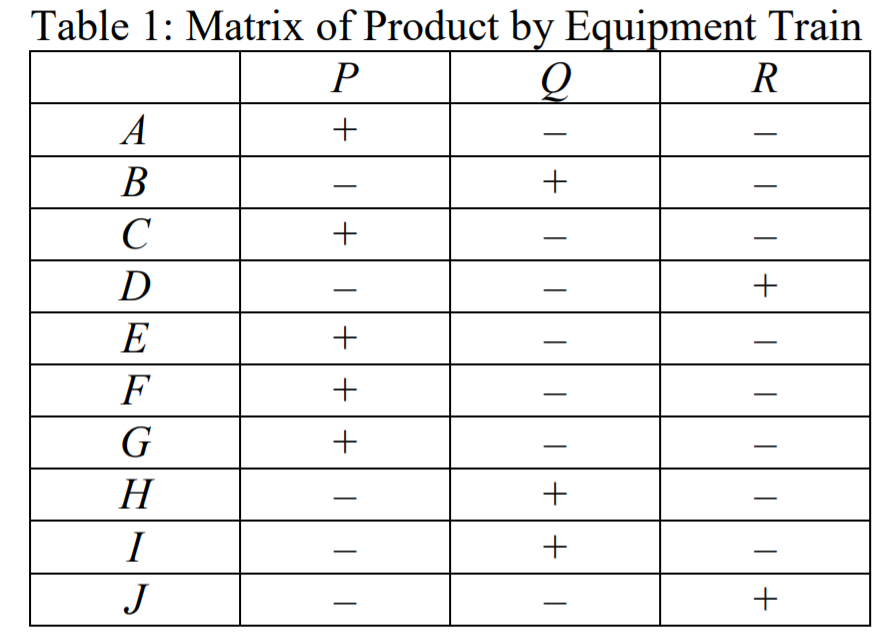
This matrix makes clear what products are made in the same equipment, and therefore what products should be considered for subsequent matrices as limits are calculated. From Table 1, I can clearly see that Products A, C, E, F, and G are all made on equipment train P, so that limits for each of those products should be calculated using each of the other products as the next product.
So for my next matrix, I list the products made in the same equipment train horizontally along the top (these represent the subsequently manufactured product) and also vertically along the side (these represent the cleaned product). Within each intersecting cell, I enter the calculated limit (which could be a L2, L3, or L4 value, depending on my approach). Note that for this example in the Table 2 matrix, I will not consider the possibility that the same product will follow itself (for example, A followed by A), but that could be done.
Table 2 is the resulting matrix for equipment train P, using limits as L4b (ppm in the extracted swab sample). I could also set up a similar matrix for products made in Q and for products made in R.
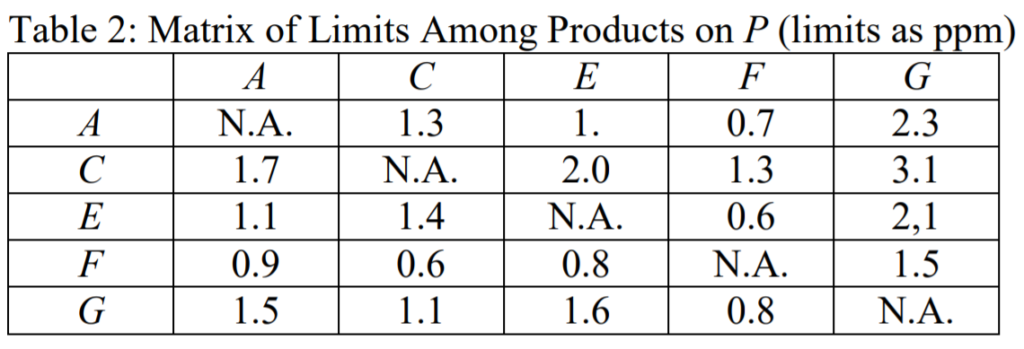
Using this matrix for P, I can readily see that the lowest limit (for the actives of A) for cleaning of A with C, E, F, and G as the next products is 0.7 ppm. Therefore, if I do a validation protocol for A, I select the lowest limit considering each of the possible next products for my L4b limit for A. I can then select the applicable limit in the same way for each of C, E, F and G.
Okay, so much for how we generally referred to “matrixing” in the early days of cleaning validation. While that use of the term is still applicable today, there is another use of the term “matrixing” that is also used today. This newer use of the term “matrixing” is similar to what I call “grouping”. It applies specifically to the use of a matrix to determine the worst-case product in that grouping approach (which is one way, but not the only way, to select that worst-case product). In this situation, my matrix involves each product horizontally along the top (these represent the cleaned product) and a variety of relevant parameters that are used to determine the worst-case product vertically along the side, with a last row being an overall worst-case value. Within each cell, a rating for each parameter for each product is made based on a predetermined scale. In this case, I am rating everything on a scale of 1 to 5 except for dyes/colorants (which is a scale of 1 to 2), with higher numbers being worst cases. The “Overall Rating” in the last row is a result of multiplying the ratings for the individual parameters for that product. Using the products made on P, Table 3 illustrates this type of matrix.
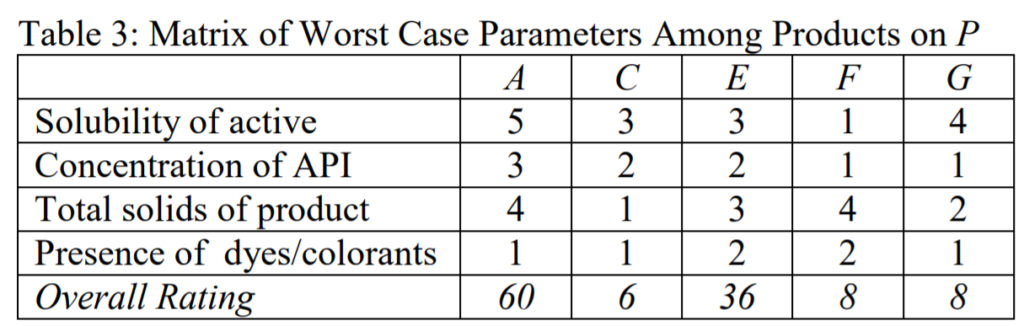
In this manner, I am using a matrix to determine the worst-case product for grouping purposes. In this example, the worst-case product is A.
Some clarifications are in order. First, the examples in Tables 1, 2, and 3 are just examples, but hopefully they illustrate the concept of the different matrices used. Second, even those companies which use the term “matrixing” to cover what is done in the Table 3 example will also typically perform (directly or indirectly) the matrixing concepts illustrated in Tables 1 and 2. Third, some companies for the Table 2 matrix where the equipment surface area is exactly the same for all combinations will just determine the ratios of “batch size” to “maximum daily dose” for the next products, and use the lowest ratio among the different next products to calculate the lowest limit for a given product. In this case, there may be no matrix clearly used, but the matrix concept is present in that approach. Fourth, some companies use software to do all three types of matrices, in which case the matrix determinations are implicit in the software results.
When all is said and done, I still prefer the use of the term “grouping” to cover the situation illustrated by Table 3. Part of the reason is to separate it from matrixing done as illustrated in Tables 1 and 2, which are still applicable even if I don’t do a product grouping approach.
In any case, the purpose of this Cleaning Memo is to encourage companies to carefully define terms such as “matrixing” and “grouping” so they are used consistently within that company. Careful definitions help avoid inconsistencies within a company as well as help avoid misunderstandings of a company’s approach by regulators or auditors.


